Today I would like to kick off a series of posts on the most useful areas in the Project Portfolio Management with financials suite. Since there are a multitude of different modules, workspaces, workbenches and reports, I would like to take you on a tour of the areas I’ve found most useful in the deployments we’ve been engaged on.
Demand Workbench
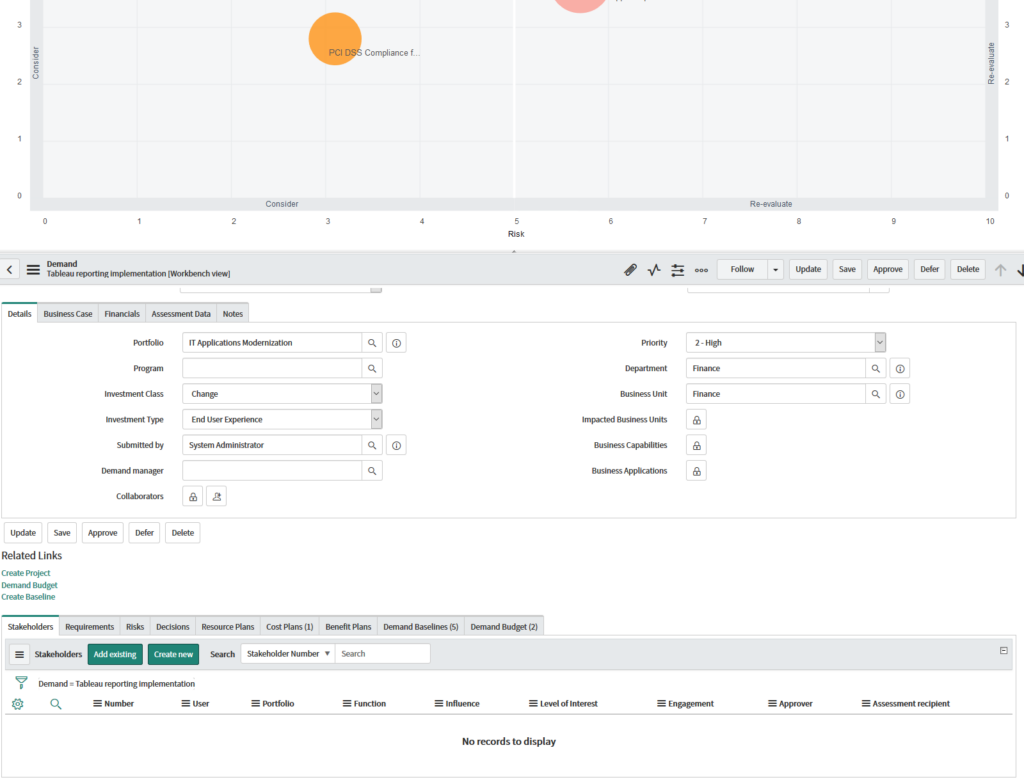
The Demand workbench is a centralized location for viewing and assessing business demands. It provides a single pane of glass to not only visually see where demands fit within the Risk / ROI matrix, but also allows you to visualize the size and scope of demands.
The workbench is broken out into two areas the Bubble Chart, and the List Pane. Let’s examine the two areas.
Bubble Charts
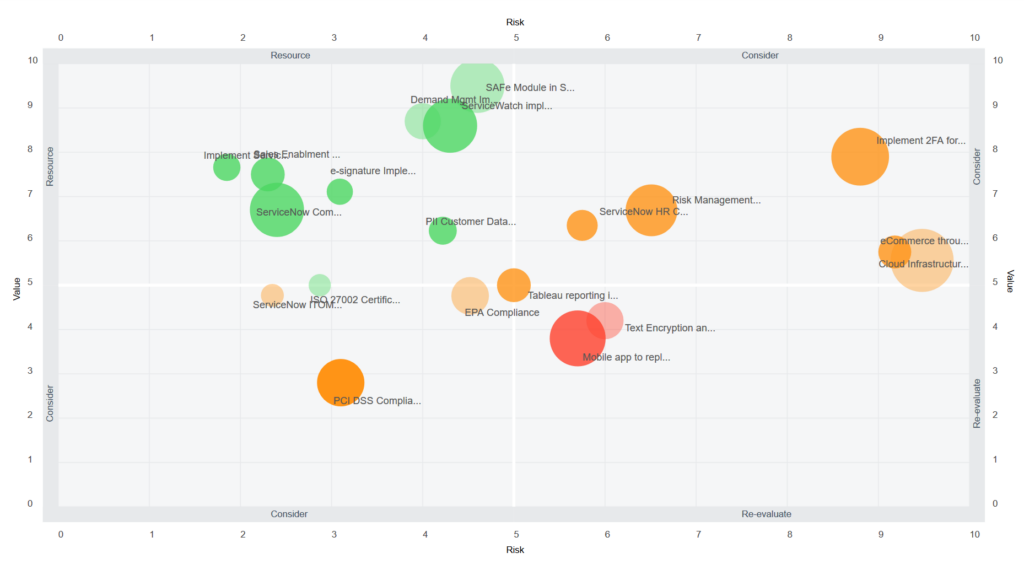
Here we can see four quadrants. Information is broken out in the following fashion.
- The upper left quadrant, labeled Resource, contains demands with high value and low risk. Green bubbles represent demands in this quadrant.
- The lower left and upper right quadrants, labeled Consider, contain demands that require further evaluation. The lower left quadrant contains demands with low risk but low value while the upper right quadrant contains demands with high value but high risk. Orange bubbles represent demands in these quadrants.
- The lower right quadrant, labeled Re-evaluate, contains demands with low value and high risk. Red bubbles represent demands in this quadrant.
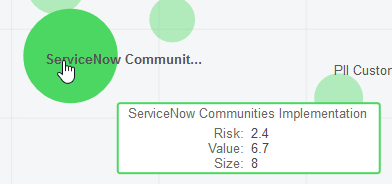
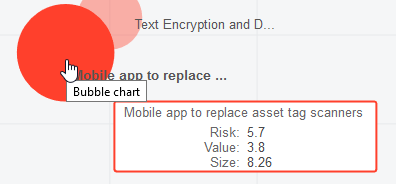
Demand Managers can hover over any bubble and instantly see information related to the Size, Risk, and Value it has to the business.
Demands with Lower Risk and Higher Value are perceived to have greater benefit to the company and should be pursued as it often grants you a higher ROI on your investment.
Conversely Demands that have a higher risk and lower value are graded to have a Lower ROI and should be re-evaluated as a priority to the business.
Depending on internal conversations you can modify your goals, and targets by moving the demand bubbles to any quadrant given they have the correct benefit to your business.
List View
The list view within the demand workbench offers us a more granular look on how a particular demand is being scored, as well as it’s stage in the demand pipeline.
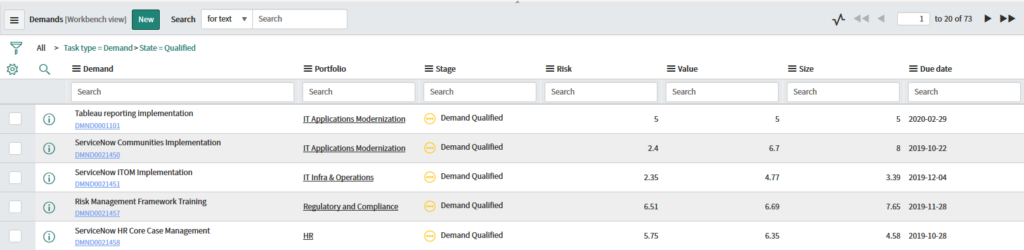
When looking at demands you can see information at a glance and if you need more information it can easily be added by configuring the columns you need from the personalize columns space.
You also have the ability to navigate straight to any demand by simply clicking on the demand. Here the demand will open up in the same window giving you instant access to make changes. This allows you fast access to make changes to:
- Requirements
- Cost Plans
- Resource Plans
The demand workbench is a one stop shop to manage all your demands. It offers quick and easy access to make changes on any qualified demand leaving you free to push those demands that offer low risk / high value into fully fledged projects your company can execute on.
As always if your company would like assistance deploying ServiceNow’s Project Portfolio Management solution in your enterprise, we can assist in the Design, Collaboration, Deployment, and Management of your deployment.
Next month on our series roadmap? Project Workspace! See You then!